
Quick answer: ITSECOPS Research publishes original data from our own engagements: what we measured inside real Microsoft 365 tenants, SOC operations and compliance programmes, anonymised and written up so that CISOs, IT leads, defense contractors and MSPs can compare their own position against it. Every report has a free web edition with every chart open for citation, and an extended PDF edition with the full working registers and worksheets for your team. The data is ours; the names are withheld.
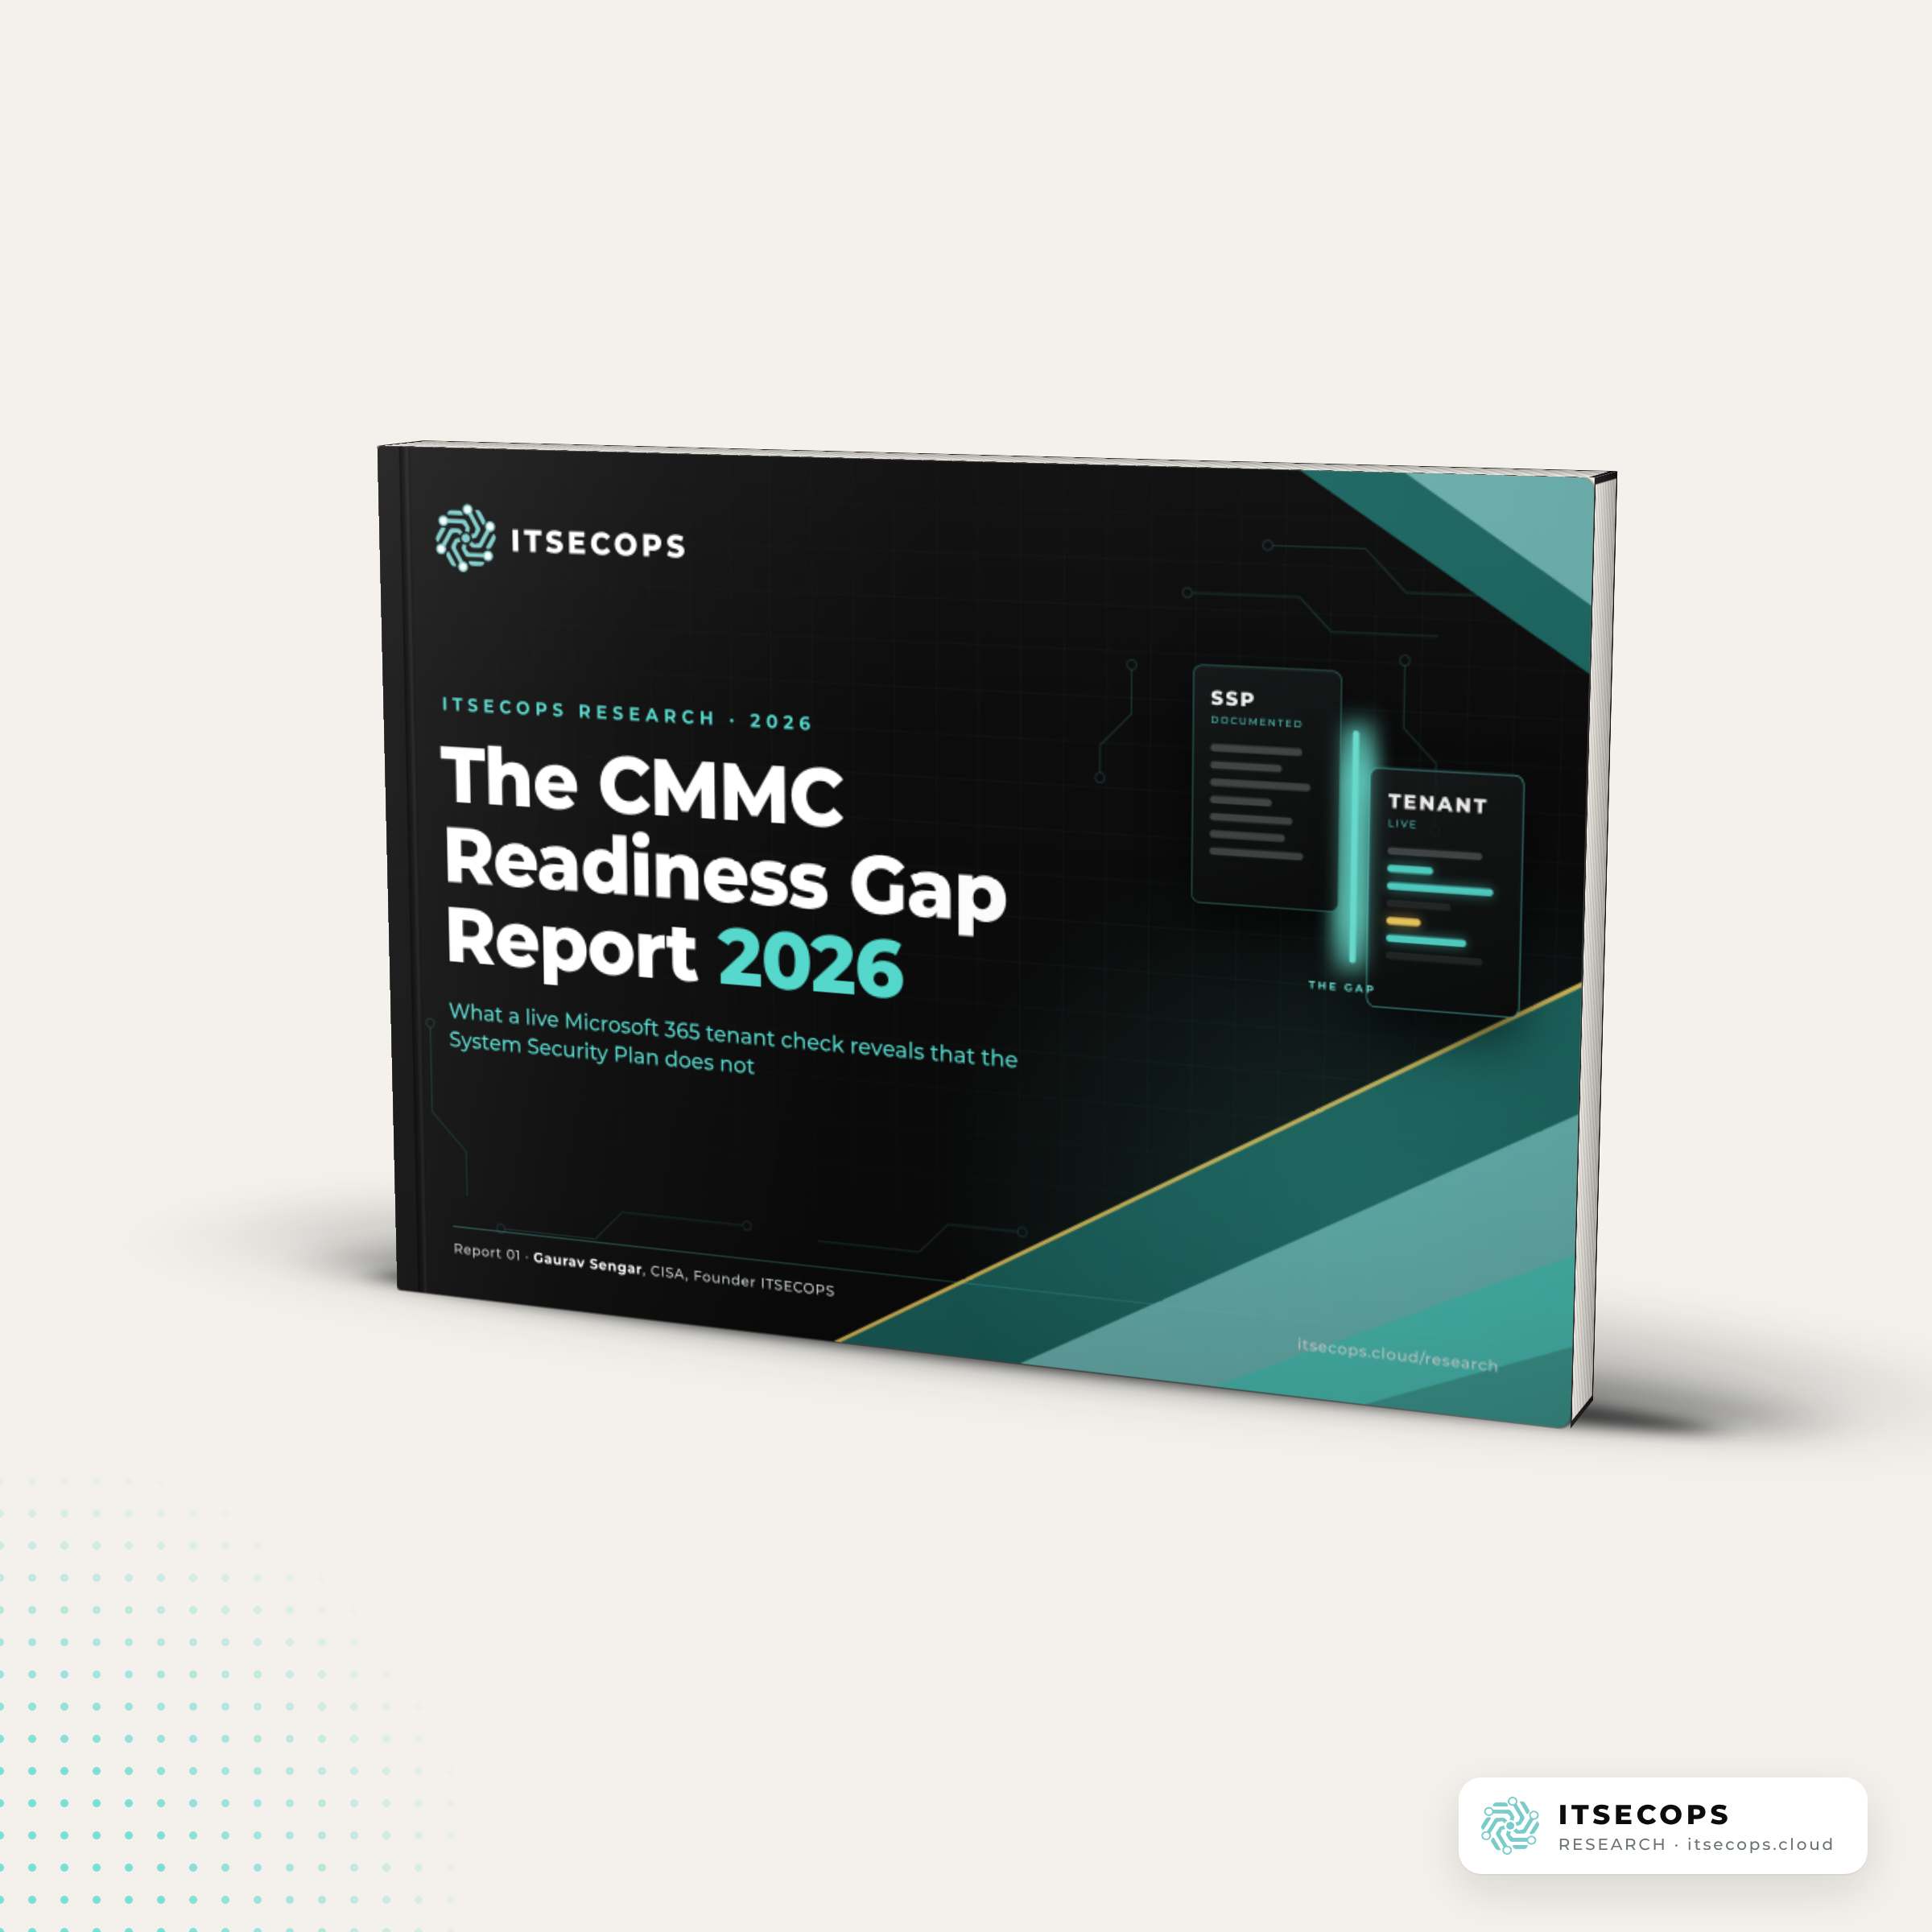
Report 01 · October 2026
The CMMC Readiness Gap Report 2026
What a live Microsoft 365 tenant check reveals that the System Security Plan does not. One full CMMC Level 2 readiness engagement, 38 C3PAO-style live checks in Intune and Entra ID, and what it means for every contractor posting a self-assessment score during the Phase 2 pause.
How ITSECOPS Research works
Each report starts from engagement working papers: gap assessments, evidence reviews, live console walkthroughs, SOC incident timelines and cost models we built for clients. We anonymise the client, its people, sites and vendors, keep the numbers, and add the public context a reader needs to judge the result (rule text, enforcement cases, industry surveys, each one linked). Reports are written by the ITSECOPS consultants who did the work and are reviewed before release. Readiness and benchmarking language only: ITSECOPS is a consultant and managed services provider, not an auditor or a C3PAO, and no report is a certification determination.
Coming next
Cite, reuse or request the data
Every chart may be reused with the attribution printed under it. Journalists, prime contractors, auditors and MSPs who want the anonymised underlying working papers under NDA can write to saleslead@itsecops.cloud. If a report describes your situation, book a 30 minute review and we will walk the findings through against your environment.
Frequently asked questions
Is the data in ITSECOPS Research real?
Yes. Every figure comes from ITSECOPS engagement working papers or from a cited public source. Clients are anonymised; numbers are not altered.
Can I use the charts in my own presentation?
Yes, with the attribution line printed under each chart. Link to the report page when you publish online.
Why is part of each report behind a form?
The findings, charts and FAQs are free and open to search engines and AI assistants. The extended edition contains the working registers, checklists and worksheets our consultants use, and we ask for a work email and company so the right specialist can follow up if you want help. No newsletter, no cold calls.